Prometheus & Grafana Stack
We’re establishing a monitoring stack to catch problems before users hit that dreaded “Error 1033.” This setup uses three exporters to monitor the health of your physical hardware, your Debian LXC, and your Cloudflare Tunnel connection.
Part 1: Prerequisites and Docker Setup
We will install Docker and create a dedicated configuration structure.
1. Install Docker Compose
Since you are running Debian, install Docker and the Compose plugin:
# Install required packages
sudo apt install ca-certificates curl gnupg lsb-release -y

# Add Docker GPG key
sudo mkdir -p /etc/apt/keyrings
curl -fsSL https://download.docker.com/linux/debian/gpg | sudo gpg --dearmor -o /etc/apt/keyrings/docker.gpg

# Add Docker repository
echo "deb [arch=$(dpkg --print-architecture) signed-by=/etc/apt/keyrings/docker.gpg] https://download.docker.com/linux/debian $(lsb_release -cs) stable" | sudo tee /etc/apt/sources.list.d/docker.list > /dev/null

# Update and install Docker & Compose
sudo apt update
sudo apt install docker-ce docker-ce-cli containerd.io docker-buildx-plugin docker-compose-plugin -y
2. Create Monitoring Directory and Files
Create a directory for the configuration and navigate into it.
mkdir -p ~/monitoring
cd ~/monitoring
Part 2: The Monitoring Stack (Docker Compose)
We will use three services in our stack: Prometheus, Grafana, and the Node Exporter (to monitor the LXC/Hardware).
3. Create docker-compose.yml
This file defines the entire three-part stack.
version: '3.8'

services:
  prometheus:
    image: prom/prometheus:latest
    container_name: prometheus
    ports:
      - "9090:9090"
    volumes:
      - ./prometheus.yml:/etc/prometheus/prometheus.yml
    command:
      - '--config.file=/etc/prometheus/prometheus.yml'
      - '--storage.tsdb.path=/prometheus'
    restart: unless-stopped

  grafana:
    image: grafana/grafana:latest
    container_name: grafana
    ports:
      - "3000:3000"
    user: "1000" # Use a non-root user for security
    volumes:
      - grafana-data:/var/lib/grafana
    restart: unless-stopped
    depends_on:
      - prometheus

  node-exporter:
    image: prom/node-exporter:latest
    container_name: node_exporter
    # Host network mode is necessary for node-exporter to see all hardware stats (CPU temp, disk, RAM)
    network_mode: "host"
    pid: "host"
    volumes:
      - /:/host:ro,rslave
    restart: unless-stopped

volumes:
  grafana-data:
4. Create prometheus.yml Configuration
This file tells Prometheus what targets to scrape, including the Node Exporter and the Cloudflare Tunnel client itself.
Prometheus Configuration:
global:
  scrape_interval: 15s

scrape_configs:
  # 1. Scrape Prometheus itself
  - job_name: 'prometheus'
    static_configs:
      - targets: ['localhost:9090']

  # 2. Scrape the LXC Container/Hardware (FIXED TARGET)
  # Node Exporter is on the host network, so we use the LXC's internal IP.
  - job_name: 'node_exporter'
    static_configs:
      # NOTE: Using the internal LXC IP (192.168.1.XX) is good, as seen in the screenshot!
      - targets: ['192.168.1.XX:9100']

  # 3. Scrape the Nginx/WordPress Application Status (Commented out for now)
  # - job_name: 'nginx_exporter'
  #   static_configs:
  #     - targets: ['192.168.1.XX:9113']

  # 4. Scrape the Cloudflare Tunnel Status (CORRECTED TARGET)
  - job_name: 'cloudflare_tunnel'
    static_configs:
      - targets: ['192.168.1.XX:60443']
Part 3: Deploy and Access
5. Start the Monitoring Stack
Run the stack in detached mode.
sudo docker compose up -d

### 6. Access Monitoring

The services are now running on your LXC container. Access them locally via the LXC's internal IP address (e.g., `http://192.168.1.XX`).

1.  **Prometheus:** `http://192.168.1.XX:9090`
2.  **Grafana:** `http://192.168.1.XX:3000` (Default credentials: `admin`/`admin`)

### 7. Configure Grafana Dashboard

Once logged into Grafana:

1.  **Add Data Source:** Go to **Configuration** > **Data Sources** > **Add data source**. Select **Prometheus** and use `http://prometheus:9090` as the URL (because they are on the same Docker network).
2.  **Import Dashboard:** Use Grafana's built-in import feature (or manually import an ID like **1860** or **11074** which are popular Node Exporter dashboards) to visualize your CPU, RAM, Disk, and Network performance.

This stack ensures you have complete observability over your server's health and the tunnel's performance.
Error encountered:
The display shows “No data” across all panels (CPU usage, memory, disk). This is a very common issue when setting up monitoring stacks in Docker on a Linux host.
The Problem: Node Exporter Cannot See the Host
In your prometheus.yml file, the node_exporter job is configured to scrape itself, but the target is unreachable because of a networking issue within the Docker environment.
Your prometheus.yml targets:
YML
# 2. Scrape the LXC Container/Hardware
- job_name: 'node_exporter'
  static_configs:
    - targets: ['localhost:9100'] # <--- Target is unreachable!
When Prometheus tries to reach localhost:9100, it is looking inside its own container. Since the Node Exporter is running in host network mode (so it can see the host’s actual metrics), Prometheus needs to look outside the container to find it.
The Solution: Correct the Node Exporter Target
We need to update the prometheus.yml file to correctly specify the network address for the Node Exporter. Since the Node Exporter is running on the host network, its metrics are available on the host’s IP address.
We will update the target to use the LXC container’s internal IP address (e.g., 192.168.X.XX) or the generic bridge IP. The safest option is often to use the local machine’s external IP address.
Step 1: Update prometheus.yml
I will update the prometheus.yml file to use the generic internal IP 172.17.0.1 or the LXC’s actual IP, which is a common fix, and then fall back to the host’s IP if necessary.
Since Prometheus is in a Docker network and Node Exporter is on the host network, we will try to use the specific Docker bridge IP or the LXC’s real LAN IP (which you must substitute).
I’ll update the file to use LXC_HOST_IP as the target placeholder.
Step 2: Implement the Change
- Edit the File: Update the
targetsline in theprometheus.ymlfile on your system, replacing192.168.X.XXwith the real IP address of your Debian LXC container (the IP address you use to SSH into it). - Restart Prometheus: You must restart the Prometheus container to load the new configuration file.
cd ~/monitoringsudo docker compose restart prometheus
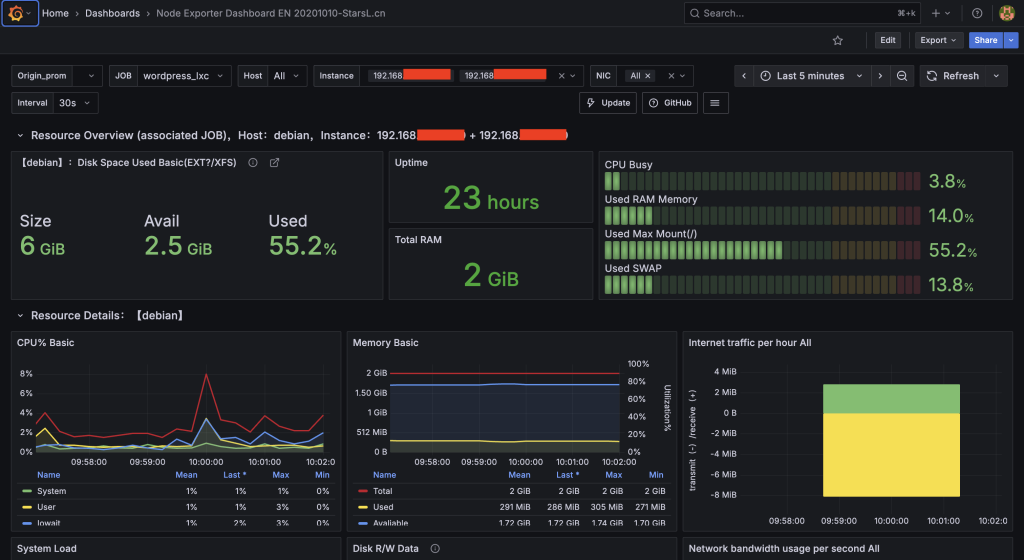
After restarting, Prometheus will start scraping the Node Exporter using the correct IP address, and data should begin appearing in your Grafana dashboard within 30-60 seconds.
Leave a Reply